
Page 15 - Black Bay Vision Plan
P. 15
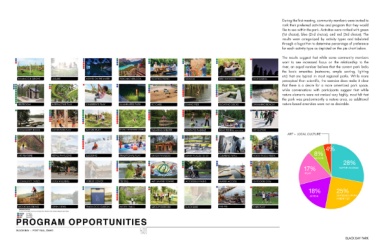
During the first meeting, community members were invited to
rank their preferred activities and program that they would
like to see within the park. Activities were ranked with green
(1st choice), blue (2nd choice), and red (3rd choice). The
results were categorized by activity types and tabulated
through a logarithm to determine percentage of preference
for each activity type as depicted on the pie chart below.
The results suggest that while some community members
want to see increased focus on the relationship to the
river, an equal number believe that the current park lacks
the basic amenities (restrooms, ample seating, lighting
etc) that are typical in most regional parks. While more
perceptual than scientific, the exercise does make it clear
that there is a desire for a more amentized park space,
while conversations with participants suggest that while
nature elements were not ranked very highly, most felt that
the park was predominantly a nature area, so additional
nature-based amenities were not as desirable.
ART + LOCAL CULTURE
4%
8%
NATURE
28%
17% WATER ACCESS
PLAY
18% 25%
ACTIVE STANDARD PARK
AMENITIES
BLACK BAY PARK